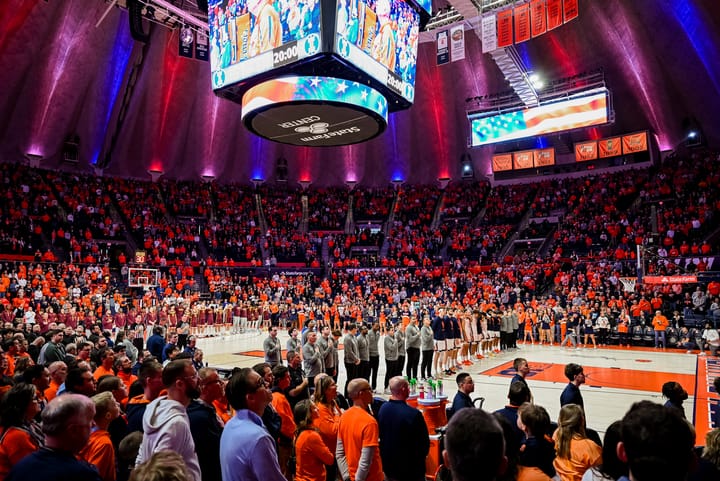
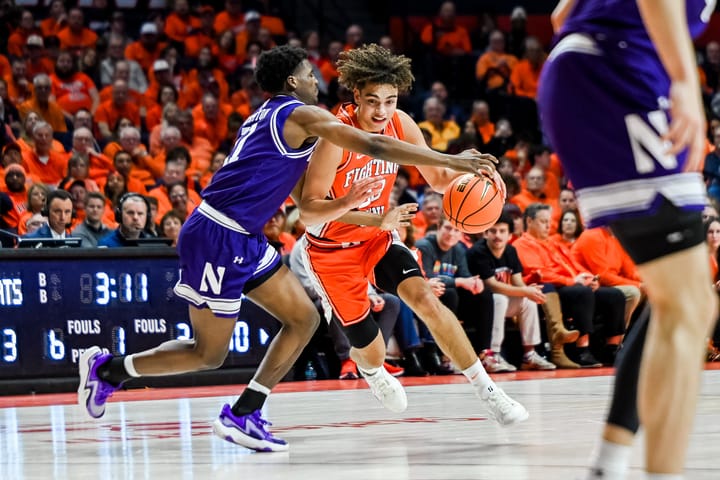
Where Do We Stand? January 14th
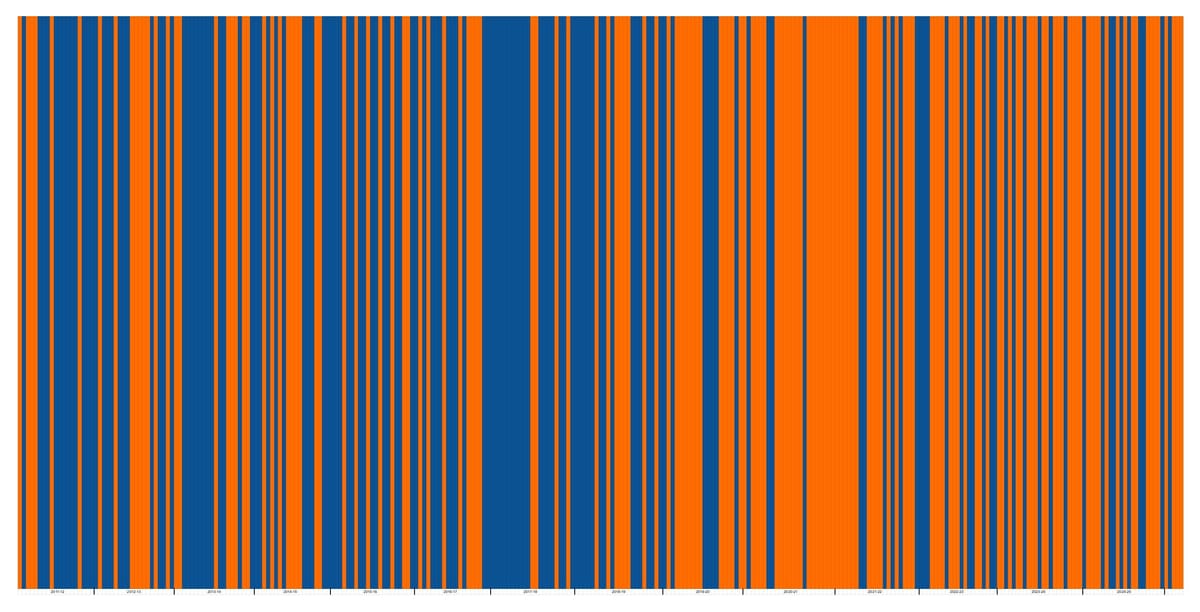
The return of the Bar Code Graph! I tweeted it yesterday but I thought it would also make for a great cover photo for this post. No, it's not a code to scan at checkout. It's a graphic representation of every Illini basketball Big Ten win and loss since Bruce Weber's final season in 2011-12. Blue for a loss, orange for a win.
More on that later. First, let's I-N-I.
The IlliniBoard NERDstat Index
As always, we begin with the NERDstat index. I take four of the predictive metrics and I average them. These are "should" and not "did" meaning they're looking forwards at which teams have performed the best in the efficiency numbers and not looking backwards at which teams have the best resume.
And here's the average of the four (KenPom, Torvik, BPI, and EvanMiya):